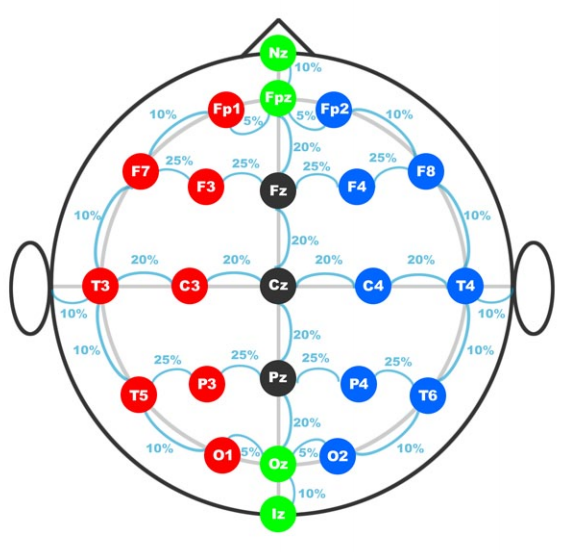
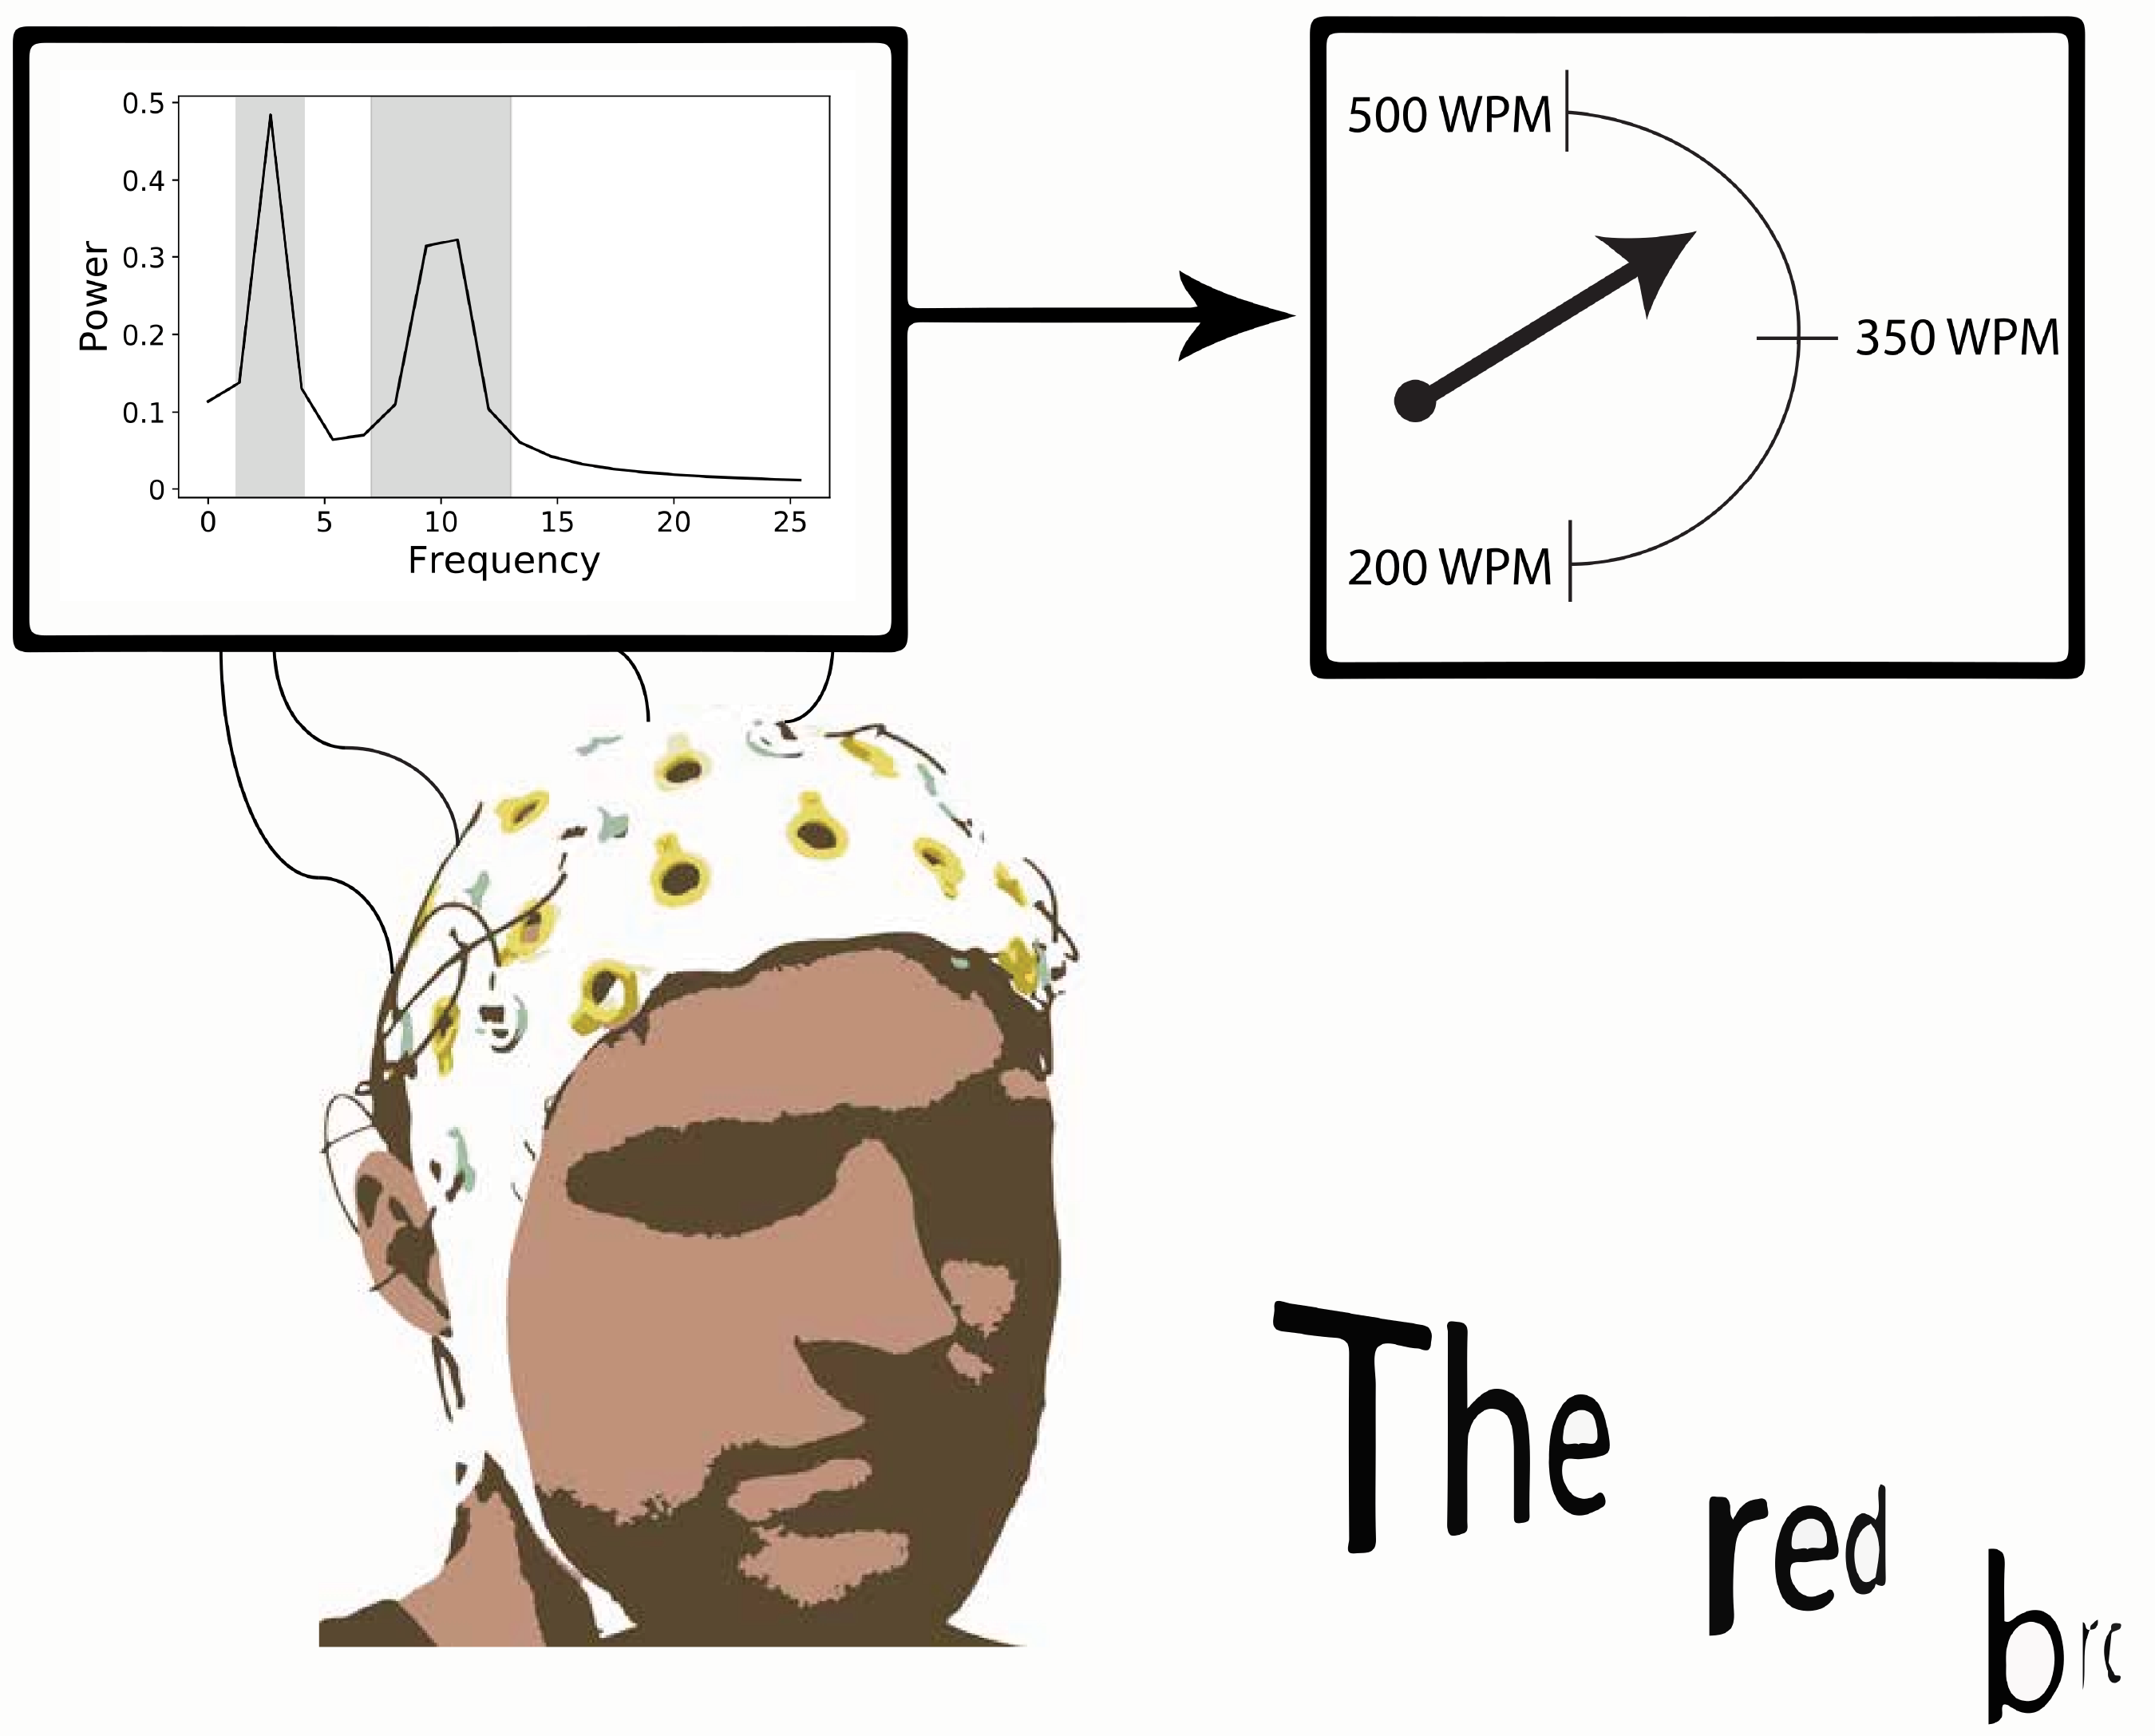
Recently, measuring brain activity (known as electroencephalography, short EEG) to enhance or analyze the experience of user interfaces has attracted great attention. Besides of medical applications, several researchers have investigated effort to make use of it in the area of human-computer interaction, resulting in several projects and publications ([1, 2, 3], just to name a few). To measure brain activity at a specific spot on a head, an electrode is attached to that place. Measurement reveal a voltage, showing the difference between the measured voltage on the head and a reference electrode. The reference electrode is placed on an arbitrary place on the body (usually the ear lobe) and is necessary to calculate the voltage drop between measurements received from the electrode and the reference electrode. Electrode spots are also denoted with unique names and usually follow a system (see Figure 1).
This gives us solely measured brain activity at certain spots, but does not reveal the localization of the generated electrical source. Several algorithms exist which solve this problem. One famous algorithm is the sLORETA algorithm [5], which accepts the measured voltages from electrodes and calculates source localization dependent on the chosen model. Knowing the source of measured voltages can be used to track diseases such as Alzheimer, ADHS, or origins of depressions.
During a research project [6], the sLORETA algorithm was implemented using an interactive 3D voxel-based visualization to make brain source localization visible. We used a heatmap-like visualization to make it understandable as possible. After running simulations of electrical activity and comparing these to our algorithm, we are able to verify the correctness of our implementation. The computation delivers a magnitude for each voxel, being responsible to visualize the electrical strength using a color code.
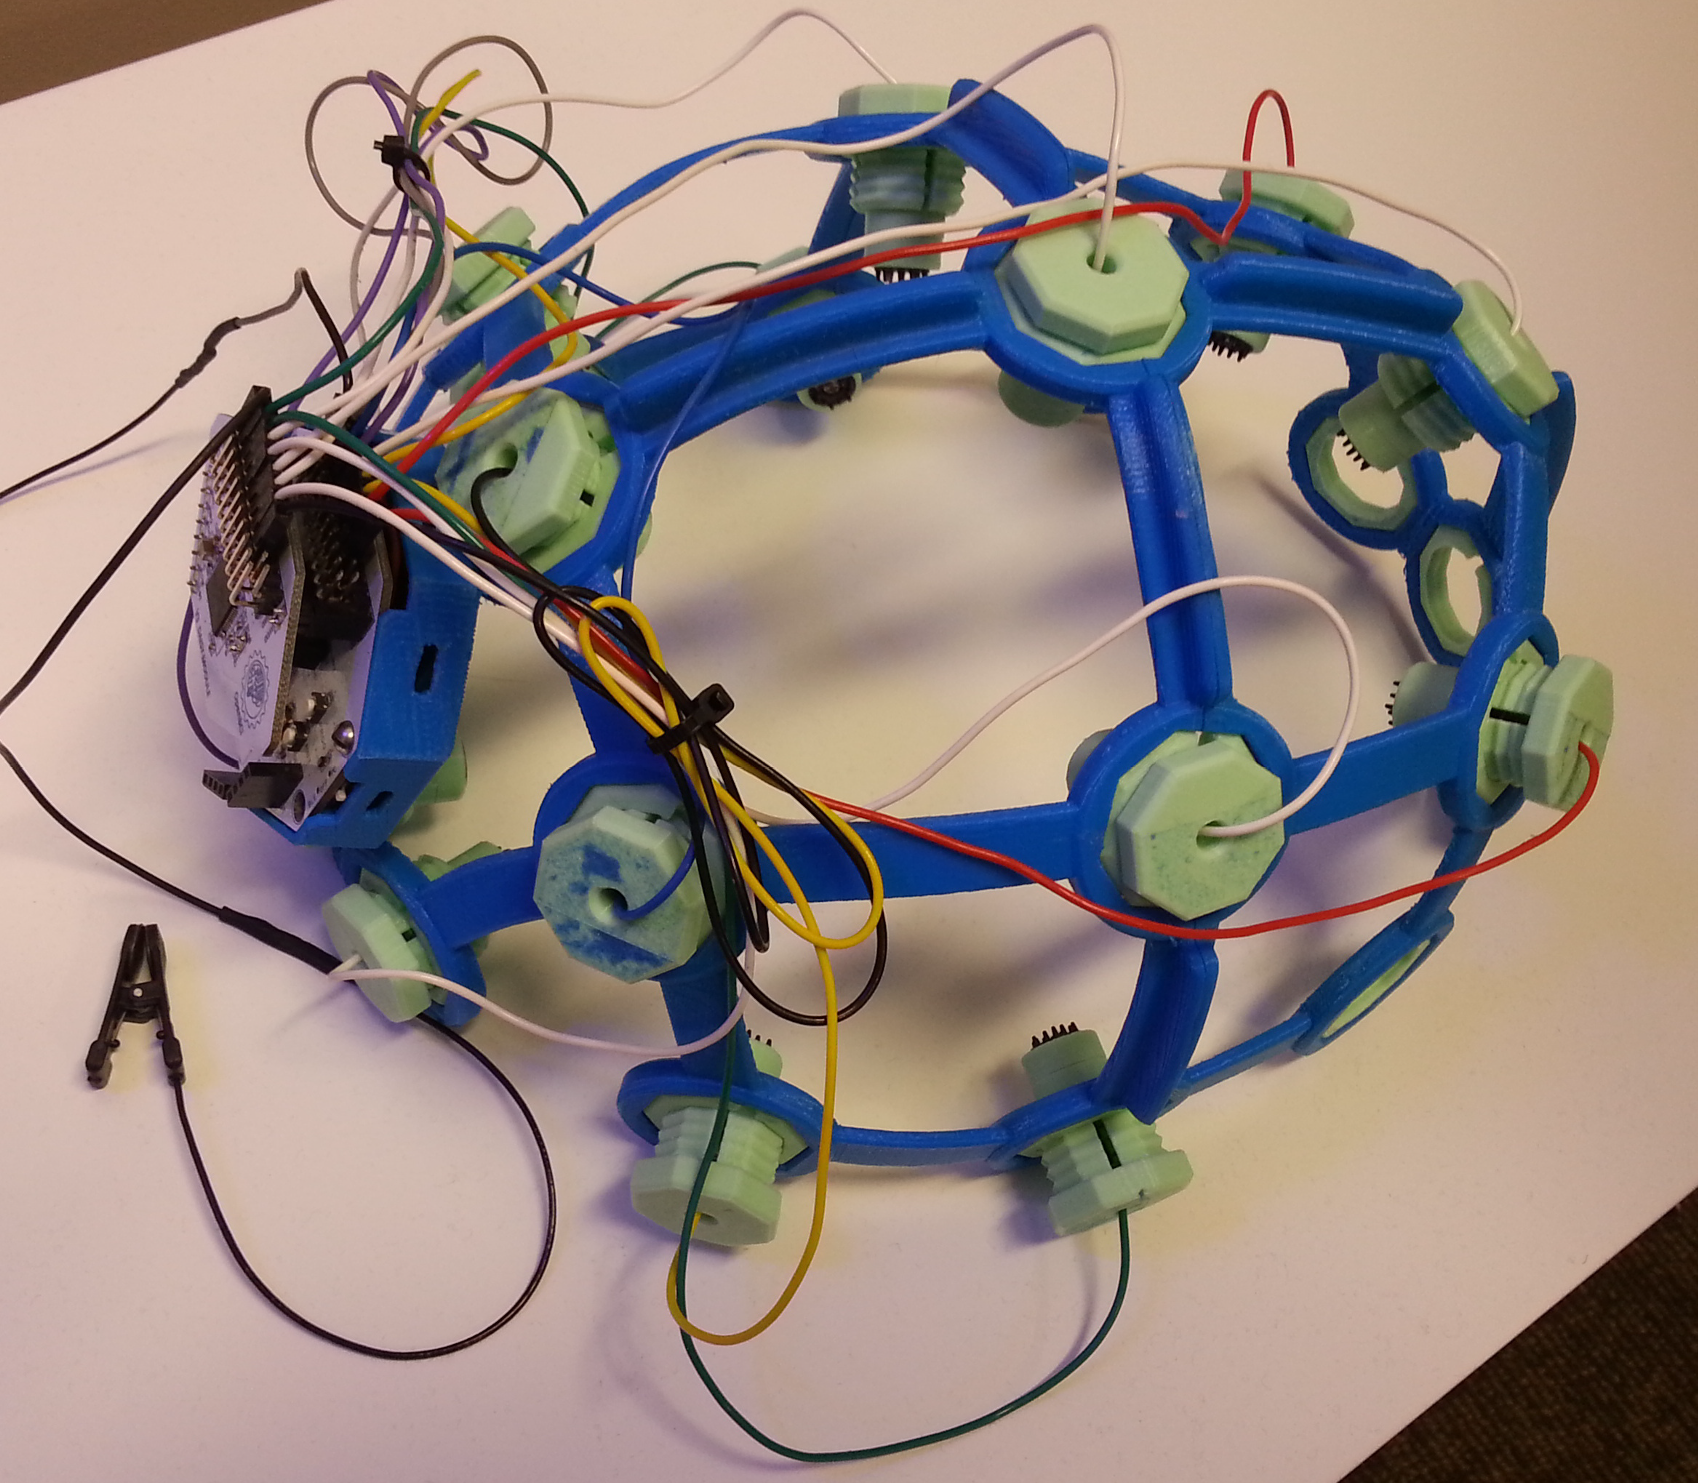
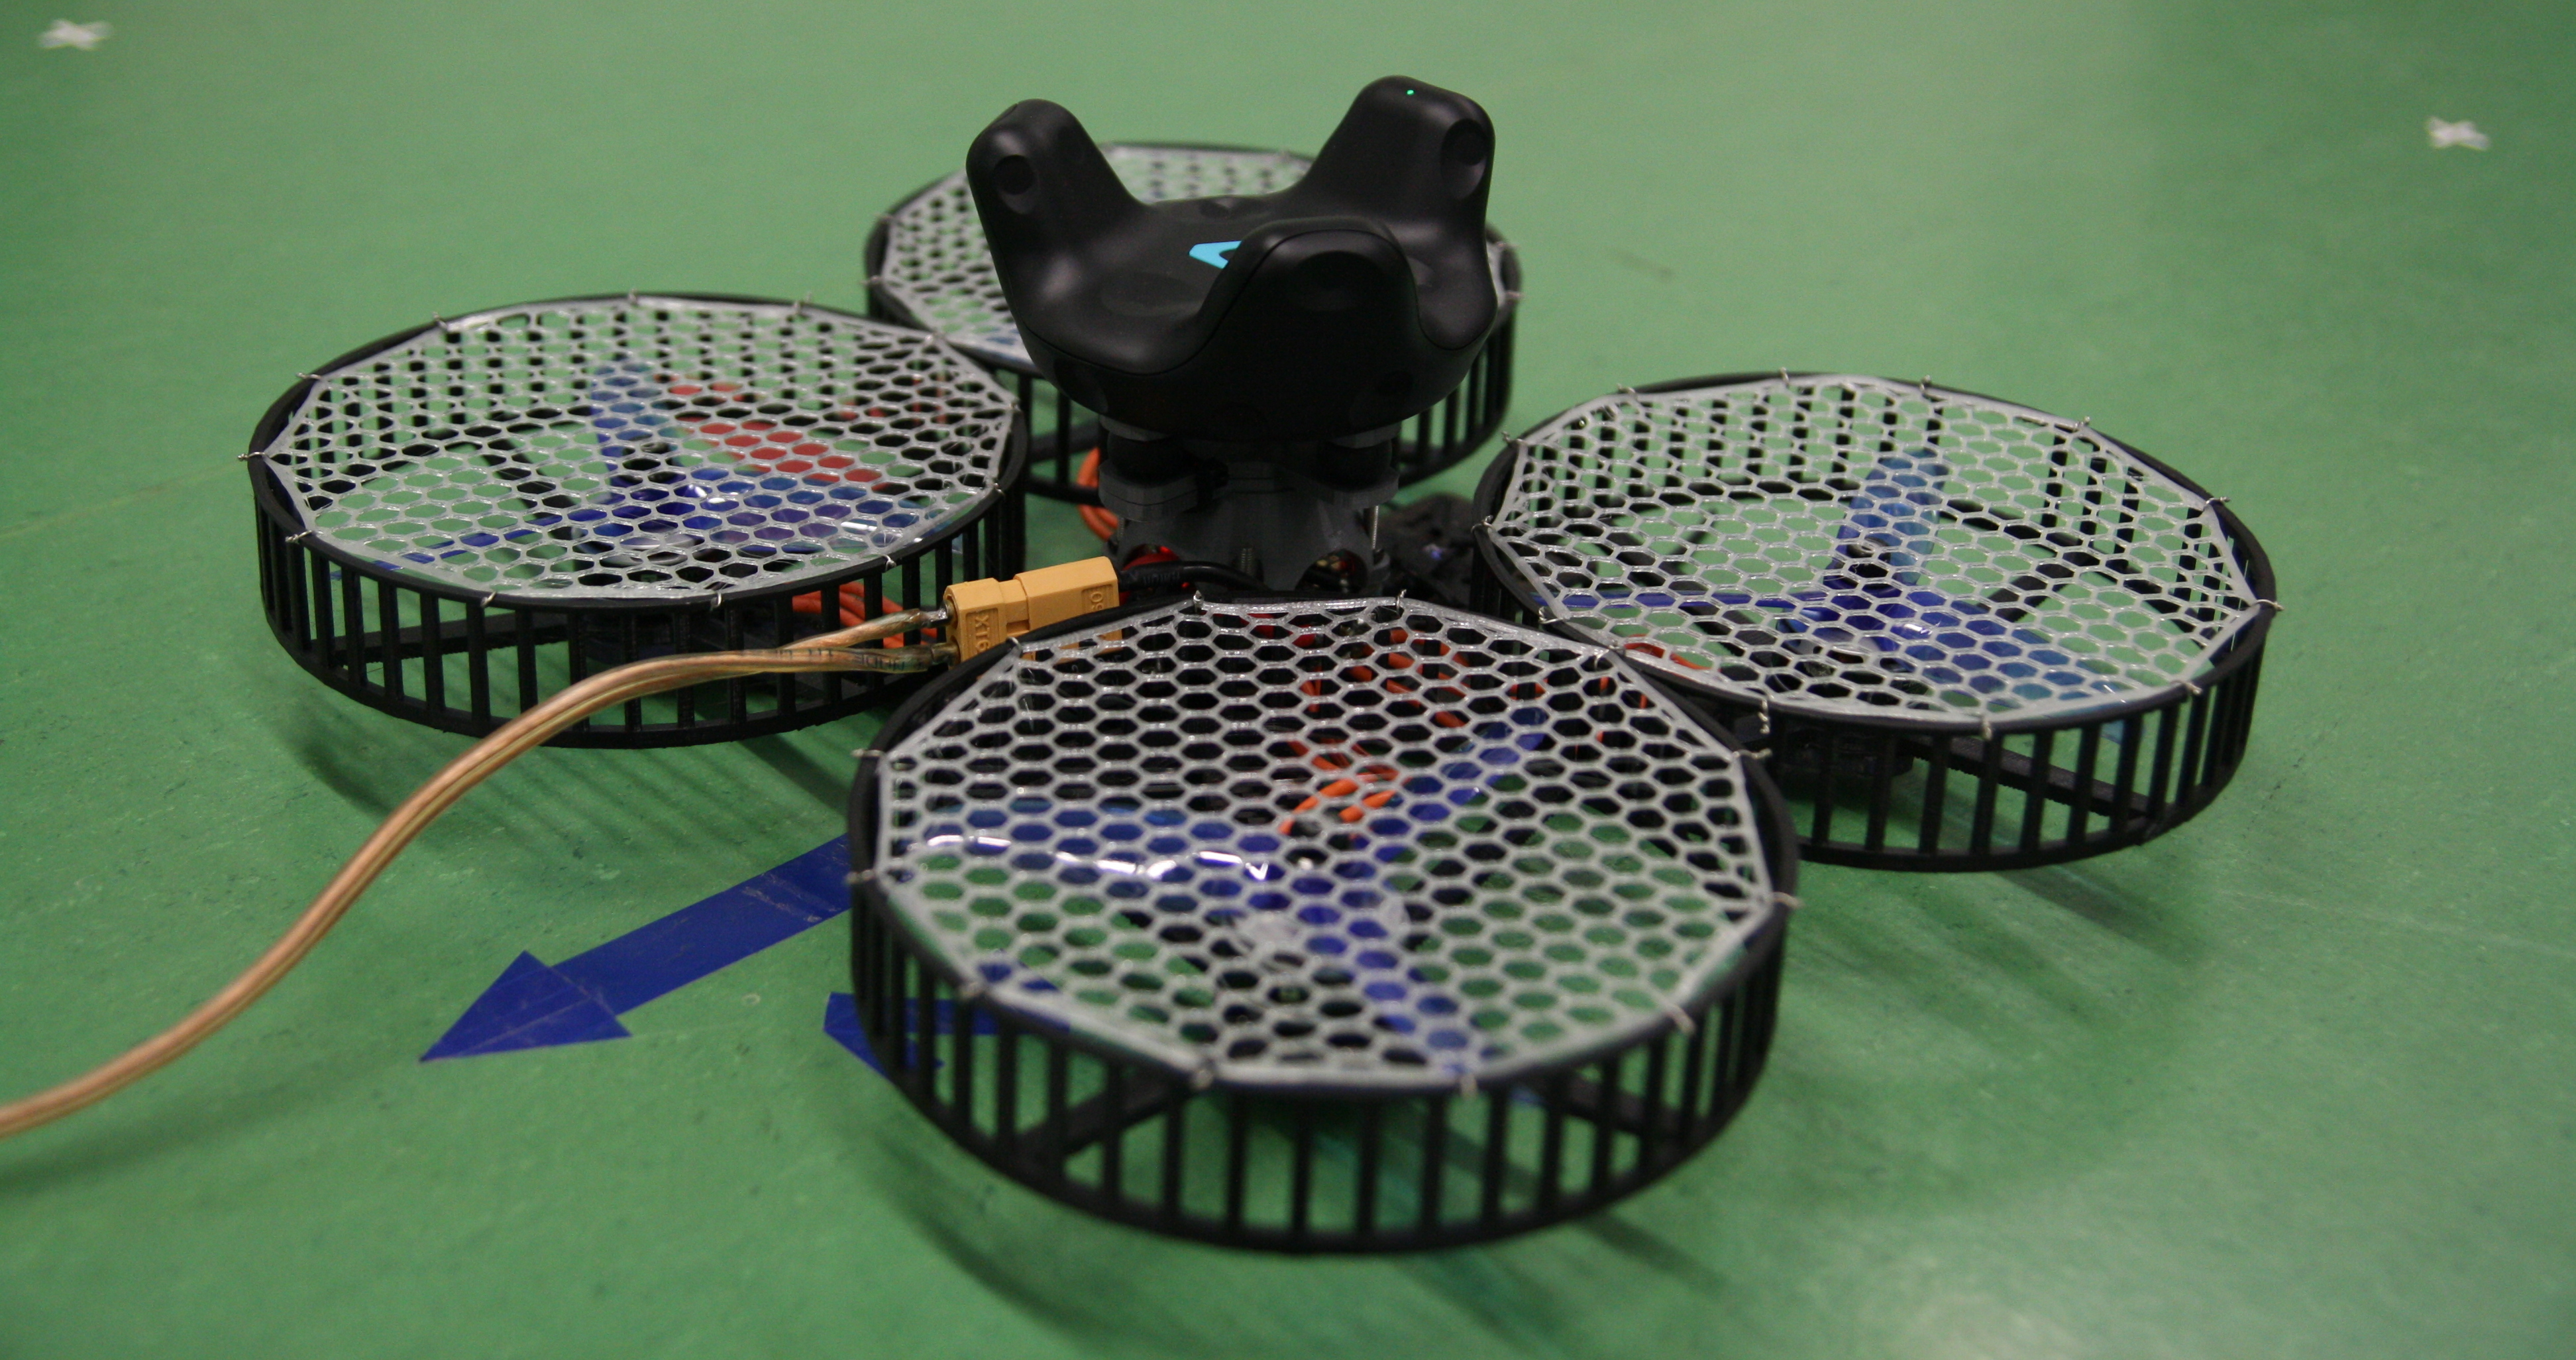
We used an 16 channel OpenBCI [7] together with an Ultracortex headset (see Figure 2) to run a pilot study in the wild while delivering stimuli in virtual reality. Implementation and visualization was integrated into the neuromore Studio platform [8], which provides support for recording EEG data and signal processing for post hoc analysis purposes. Results showed a working visualization to see where brain activity is generated. Red-colored areas show a high probability, that this area is responsible for measured voltages at different electrodes. However, blue areas denote a low probability. Changes in brain activation can be observed in real-time, making it easier to find responsible brain areas for certain input stimuli:
Of course, visualizing brain source localization is not the almighty solution to understand the brain completely. First, our implementation does not provide a high density resolution since it this highly depends on the computation power. Furthermore, results depend highly on the chosen head model. For our experiment, we have chosen a spherical head model due to its simplicity, but in reality this could lead to false results [8]. Additionally, controlled EEG experiments are elaborate to set up, which makes it hard as usage for end user purposes. Our implementation aimed for a proof-of-concept solution. When looking at the current development of consumer EEG devices in the consumer market, promising advances of visualizing brain source localization for consumers are looming ahead.
Acknowledgments go to Benjamin Jillich, Manuel Jerger and Patrick Hilsbos for providing neuromore Studio as base platform. We thank Dr. Ashley E. Stewart, Dr. Deborah C. Mash and Matthew Seely for their input regarding the pilot study.
References:
[1] Frey, J., Daniel, M., Castet, J., Hachet, M., & Lotte, F. (2016). Framework for Electroencephalography-based Evaluation of User Experience.
[2] McMahan, T., Parberry, I., & Parsons, T. D. (2015). Modality specific assessment of video game player’s experience using the Emotiv.Entertainment Computing, 7, 1-6.
[3] Wolpaw, J. R., McFarland, D. J., Neat, G. W., & Forneris, C. A. (1991). An EEG-based brain-computer interface for cursor control.Electroencephalography and clinical neurophysiology, 78(3), 252-259.
[4] https://www.trans-cranial.com/local/manuals/10_20_pos_man_v1_0_pdf.pdf
[5] Pascual-Marqui, R. D. (2002). Standardized low-resolution brain electromagnetic tomography (sLORETA): technical details. Methods Find Exp Clin Pharmacol.
[6] Kosch, T., Hassib, M., & Schmidt, A. (2016, May). The Brain Matters: A 3D Real-Time Visualization to Examine Brain Source Activation Leveraging Neurofeedback. In Proceedings of the 2016 CHI Conference Extended Abstracts on Human Factors in Computing Systems (pp. 1570-1576). ACM.
[7] http://openbci.com
[8] http://www.neuromore.com/
[9] http://www.sciencealert.com/a-man-who-lives-without-90-of-his-brain-is-challenging-our-understanding-of-consciousness