Recently, I have looked into how to measure electrodermal activity (EDA) using an Arduino board. A traditional theory of EDA states, that it varies with the skin changes of sweat glands, thus altering the electrical resistance. EDA is modulated as outcome of cognitive processes, emotions, and general human behavior. The traditional mechanic to measure EDA is straigt-forward: By inducing voltages through one electrode, an electrical output is measured using a second electrode. The higher the measured value is, the higher the EDA is.
This can be easily achieved using an Arduino. By using the 5V power to induce voltages, a second electrode is used to read the remaining voltages. For this project, you will need:
- An Arduino Uno
- Arduino IDE
- Processing IDE (for visualizing data)
- USB 2.0 A-to-B cable
- Some aluminium foil
- Velcro tape (self-adhesive tape)
- A couple of jumper cables
- Two 220 Ohm resistors (for experimental reasons)
- Some regular adhesive tape
Put the components together as shown in the picture below:
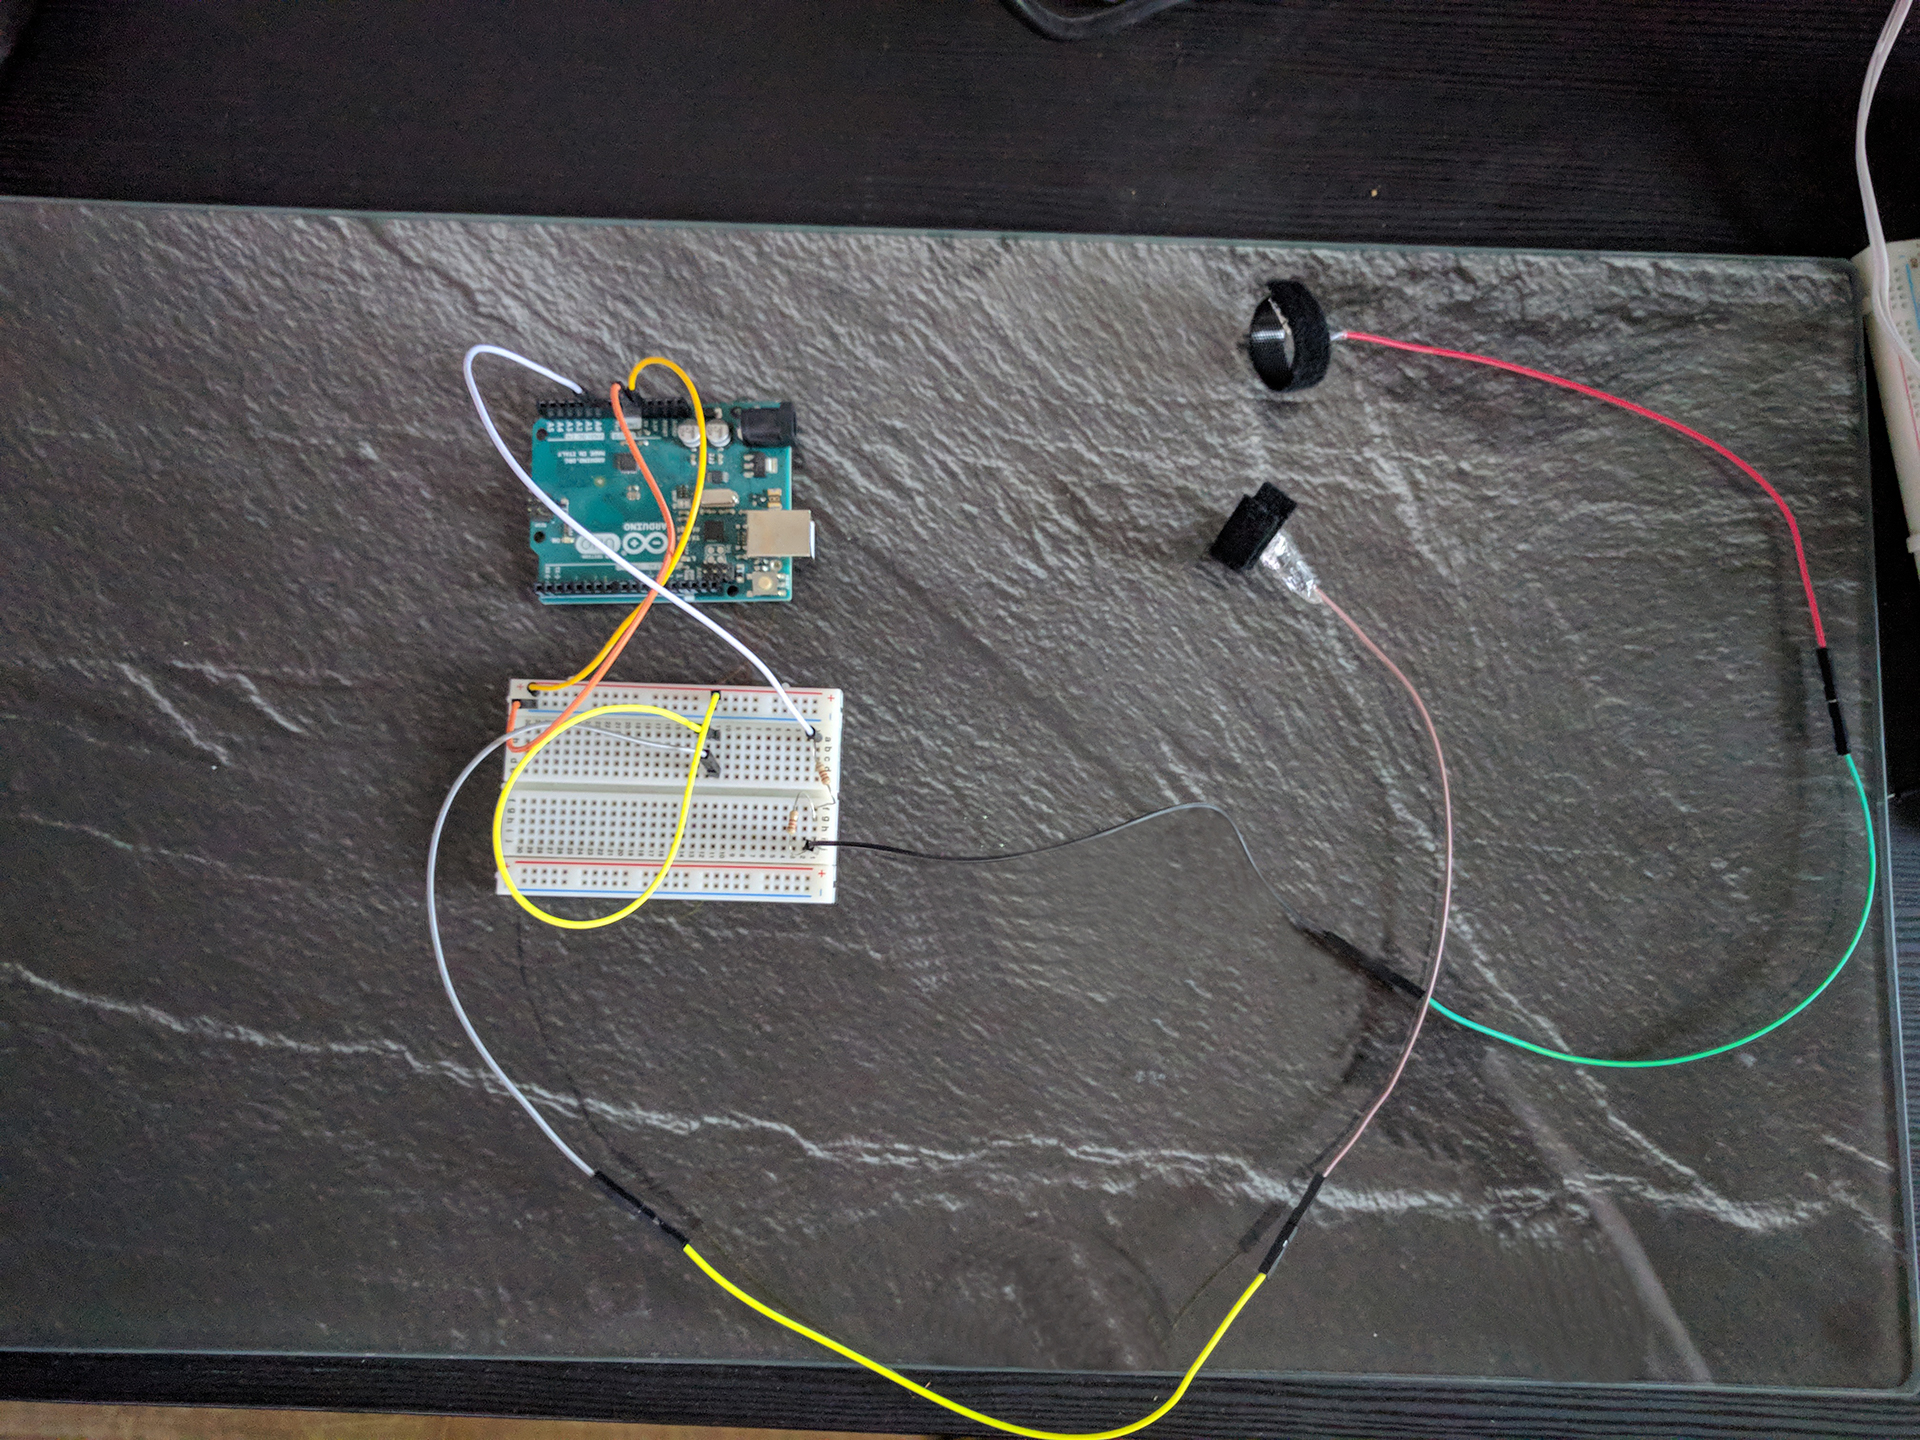
Connect one cable from the 5V output of the Arduino to a sensor. To construct a sensor, connect a jumper cable to a piece of wrapped aluminium foil. Wrap it around the Velcro tape, which will serve as a retainer for the fingers. Construct a second sensor, which is connected to the breadboard through two 220 resistors. Finally, connect a jumper cable to A0 on the Arduino board. While one sensor induces electrical voltages, the other one measures the remaining arriving electrical potential.
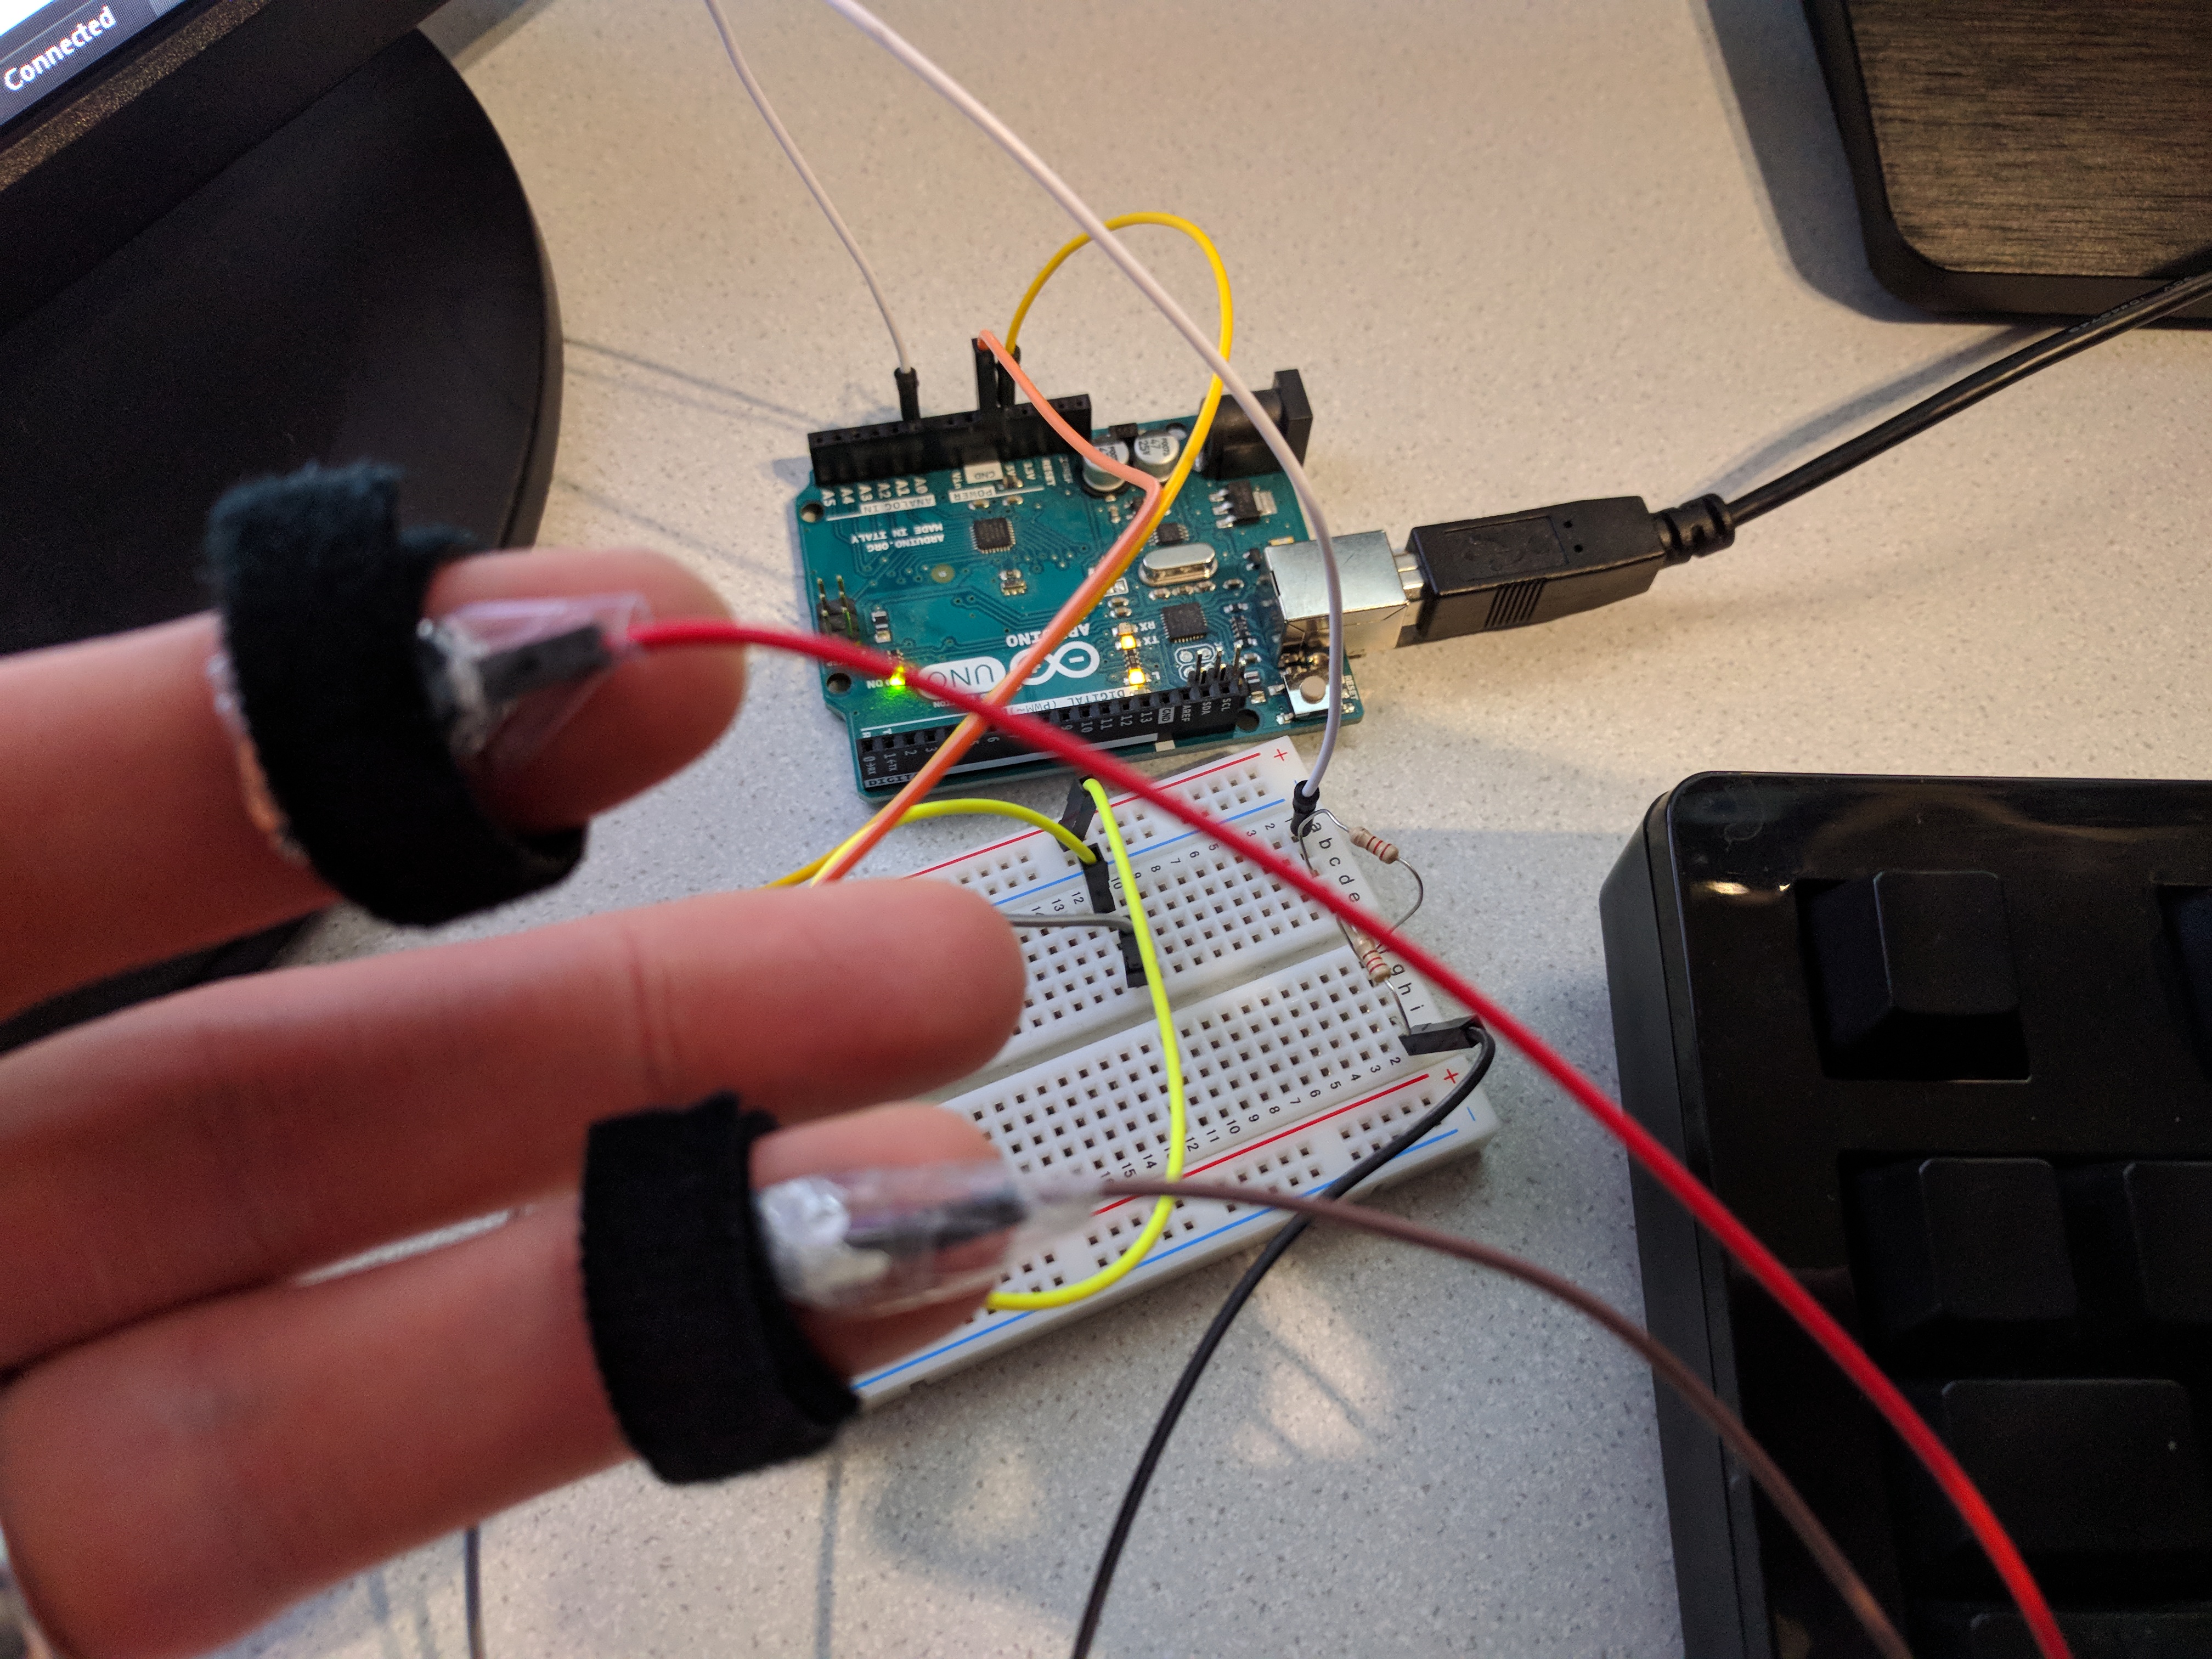
You will need some Arduino code (download here, “Save link as…”) to read the analog value received at port A0. The serial monitor should display the values sent over the serial port. I found some processing code on the web (thanks to Che-Wei Wang, http://cwwang.com/2008/04/13/gsr-reader) to visualize the outcomes (download a slightly modified version here, right-click and choose “Save link as…”). Put one sensor on your forefinger and one sensor on your ring finger:
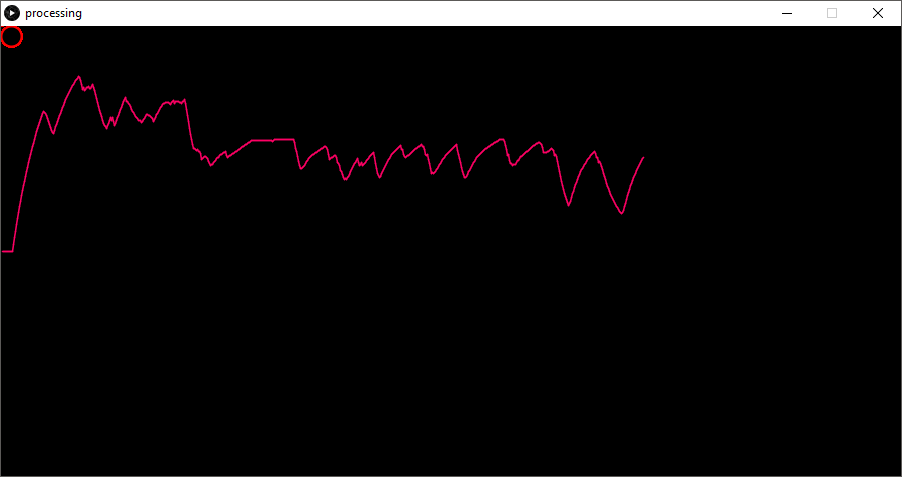
 Upload the Arduino software and run the processing software. You should get a graph visualizing you current EDA. You can modify the sensitivity of measured changes regarding the EDA by removing or changing the inserted resistors. Try to understand how different resistances modify the measured values.

